Selected projects with CGI Inc., Canada (February 2022 to Present): Starting from the most recent ones
8. Ovintiv Inc., Alberta, Canada - Application Developer (06/25 to present).
As an Application Developer, Walid is responsible for building and maintaining new applications using Microsoft Power Platform (Power App, Power Automate), fixing bugs and building new features for applications developed in R, Shiny, Python, Java, and .NET. Also, Walid is responsible for the testing and QA of applications using the automated Python scripts, and SonarQube.
7. Calgary Energy Solution Development (enVision), Alberta, Canada - Oracle SQL/APEX Developer (04/25 to 06/25).
As an Oracle SQL/APEX Developer, Walid Developed interactive reports using Oracle APEX for the Calgary energy solution development team, replacing over 50 WebFOCUS reports. Assisted the team in writing SQL for APEX reports and handling end-to-end interactive report development. Walid also used ChatGPT enterprise edition to do the AI analysis of the SQL code to better understand the underlying logic behind a WebFOCUS report.
Development Tools and Languages: SQL, Oracle, APEX, ChatGPT, Git.
6. Ministry of Health (B.C.), Canada - Building Data Analytics Solution using the Provincial Attachment System (PAS) data to manage patient-doctor attachment requests (Sep 2023 to Mar 2024).
As a Business Intelligence Developer, I was responsible for the development of a data analytics solution using the Provincial Attachment System (PAS) data. Through this solution, the province of B.C. will have a comprehensive list of who is looking for a primary-care provider and who already has one, as well as which providers and clinics can accept new patients.
Tools and Platforms: Java Script, Power BI, Power BI report server.
5. Ministry of Health (B.C.), Canada - Primary Care Division BI Modernization (Phase-2): Development of a customized data ingestion tool using the CHEFS platform to enhance data collection accuracy (Mar 2023 to Sep 2023).
As a Data Developer, I was responsible for the development of a customized data ingestion tool (CHEFS) for the Ministry of Health which will reduce the manual effort of data submission, increase report delivery speed, improve the ability to meet ad-hoc BI requests, improve the data accuracy, and enable historical business intelligence with context.
Tools and Platforms: Java Script, Power BI, Power BI report server.
4. Ovintiv Inc., Canada - Converting the SAP Business Objects (BO) into Business Intelligence reports using Power BI and Power BI report builder (July 2022 to February 2023).
As a Business Intelligence Developer, I was responsible for building Business Intelligence Reports out of the current Business Objects (BO) to support various analytics projects. I followed the data visualization and data modeling best practices to build the Power BI and paginated reports out of the on-prem Oracle database.
Tools and Platforms: Power BI, Power BI report builder.
3. Paladin Security Group Ltd, Canada - Building an efficient data pipeline to migrate the on-prem data to the cloud and developing a test automation framework to support DevOps and data quality (May 2022 to July 2022).
As a Data Engineer, I was responsible for building a data pipeline to transition the on-prem data to a cloud environment to support their analytics projects. I had to follow the data engineering best practices to build their cloud environment. I also developed the test automation framework to support the data quality process.
Tools and Platforms: Azure Synapse, SQL Server, Azure DevOps, SQL Server Management Studio.
2. Lululemon Athletica Canada Inc. - Cloud-based Solution for Seamless Data Integration and Analytics (May 2022 to June 2022).
As a Data Engineer, I gathered data requirements identifying the current scopes for a better cloud-based data solution, I was involved in retiring their current Enterprise Landing Area (ELA) in Oracle and migrating everything to Snowflake. I also suggested a better pipeline of ETL/Ingestion for data transformation and validation and finally proposed an overall cloud-based solution using Snowflake to leverage its power for seamless analysis and reporting.
Tools and Platforms: Informatica, Snowflake, Apache Airflow, Jenkins, Power BI.
1. Ministry of Health (B.C.), Canada - Modernization of Primary Care Division (PCD) to leverage the Business Intelligence for effective analytics (02/22 to 05/22)
As a Data Analyst, I gathered data requirements identifying data elements along with their source, created a flow to clearly show how the data is coming into the system, and generated the current and future process flows to show the current state and what can be improved. I also identified gaps requiring resolution for better data streamlining and automated validation, suggested an ETL/Ingestion tool for data transformation and validation, and proposed an overall solution to leverage the Business Intelligence (BI) technology for automatic analysis and reporting.
The list of projects with the Government of British Columbia, Canada (June 2020 to February 2022)
1. British Columbia COVID-19 Daily Cases: This BI report contains a breakdown of daily COVID-19 cases reported by the BC Centre for Disease Control (BCCDC). It also comprises positive cases, hospitalizations, deaths, laboratory tests, breakthrough analysis of cases by vaccination status, and time-series information for all geography levels.
2. Daily Monitoring Dashboard for COVID-19 Sites: This BI report provides breakdowns of COVID-19 immunizations for the B.C. population. The report allows data exploration by geography, age group, and select priority populations.
3. British Columbia COVID-19 Registration, Appointment, and Vaccination Coverage: This BI report provides breakdowns of registrations, appointments, and COVID-19 vaccinations for the B.C. population. The report allows data exploration by date range, geography, age group, and various stages along a person’s journey to be fully vaccinated.
4. British Columbia Emergency Departments: This BI report provides an overview of ED visits, including patient demographics and wait times as compared to benchmarks set by the Canadian Association of Emergency Physicians. The purpose of this report is to provide an overview of where EDs are experiencing congestion and capacity issues over time and across triage levels.
5. British Columbia Surgical Wait Times: This BI report allows users to monitor access to surgeries by reviewing surgical indicators.
6. Mental Health and Substance Use Service: The Mental Health and Substance Use Service, 2018/19 BI report consists of 11 measures. These measures are reported by sex, age group, health condition, geographic location, and service type (community data only) on an annual basis starting with the fiscal year 2018/19.
7. Analysis and Visualization of Patient-Centred Measurement Data: In this project, I worked on the Emergency Department (ED) survey to show results from a range of survey questions that provide patients’ perspectives on the quality of patient care in emergency departments in the province of British Columbia. The 2018 and 2021 surveys are profiled here.
8. National Health Expenditures: This BI report visualizes the full National Health Expenditure (NHEX) dataset from the Canadian Institute of Health Information (CIHI), providing a way to quickly search the full data tables and look at health spending trends from 1975 to 2019. The report is designed to let users quickly compare other jurisdictions’ health spending to British Columbia’s. The NHEX dataset covers public, private, and provincial/territorial government spending across Canada by use of funds and sources of finance.
9. British Columbia Virtual Care Physician dashboard: This BI report focuses on the physician provision of virtual care. It summarizes the changes around, and impact of, virtual care before and during (and eventually after) the COVID-19 pandemic. It provides quantifiable information on the provision and impact of virtual care on the health system. This report contains a series of figures and tables summarizing the historical and current state of the use of Virtual Care in B.C.
Tools and Languages: SQL, DAX, Power Query (M), R, Power BI, Visual Studio (to build a tabular model for Analysis Services), Tabular Editor, and SQL Server Management Studio (to deploy and manage access to tabular models in analysis services).
Selected Academic Projects: During my master’s study at the University of Manitoba
1. Custom Selectable Text Widget for Controlled Text Selection in Mobile Device (Jan 2021 – Apr 2021)
Project description: In this course project, I focused on text selection and layout, where I developed a customized text selection widget that will offer additional functionality in addition to what generally comes with the default text selection widget in most mobile apps. My developed widget will give users more control over text selection and layout than the default one. The solution is initially designed for Text selection and layout on mobile devices.
Programming platform: Android, Dart (Flutter). source code.
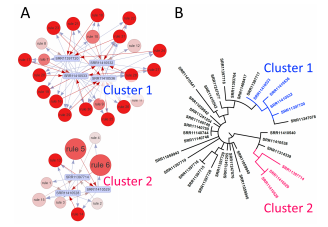
2. Visualizing Interesting Association Rules from COVID-19 Datasets (Jan 2020 – Apr 2020)
Project description: This project involves applying data mining techniques on COVID-19 data to extract association rules and visualize these rules as a network. We explore the use of association rule networks, where association rules are represented as nodes with edges connecting to items within the rule as a method to extract interesting patterns within a variety of COVID-19 datasets. This GitHub repository includes code and supplementary materials for the project.
Programming platform: Python, Jupyter Notebook.
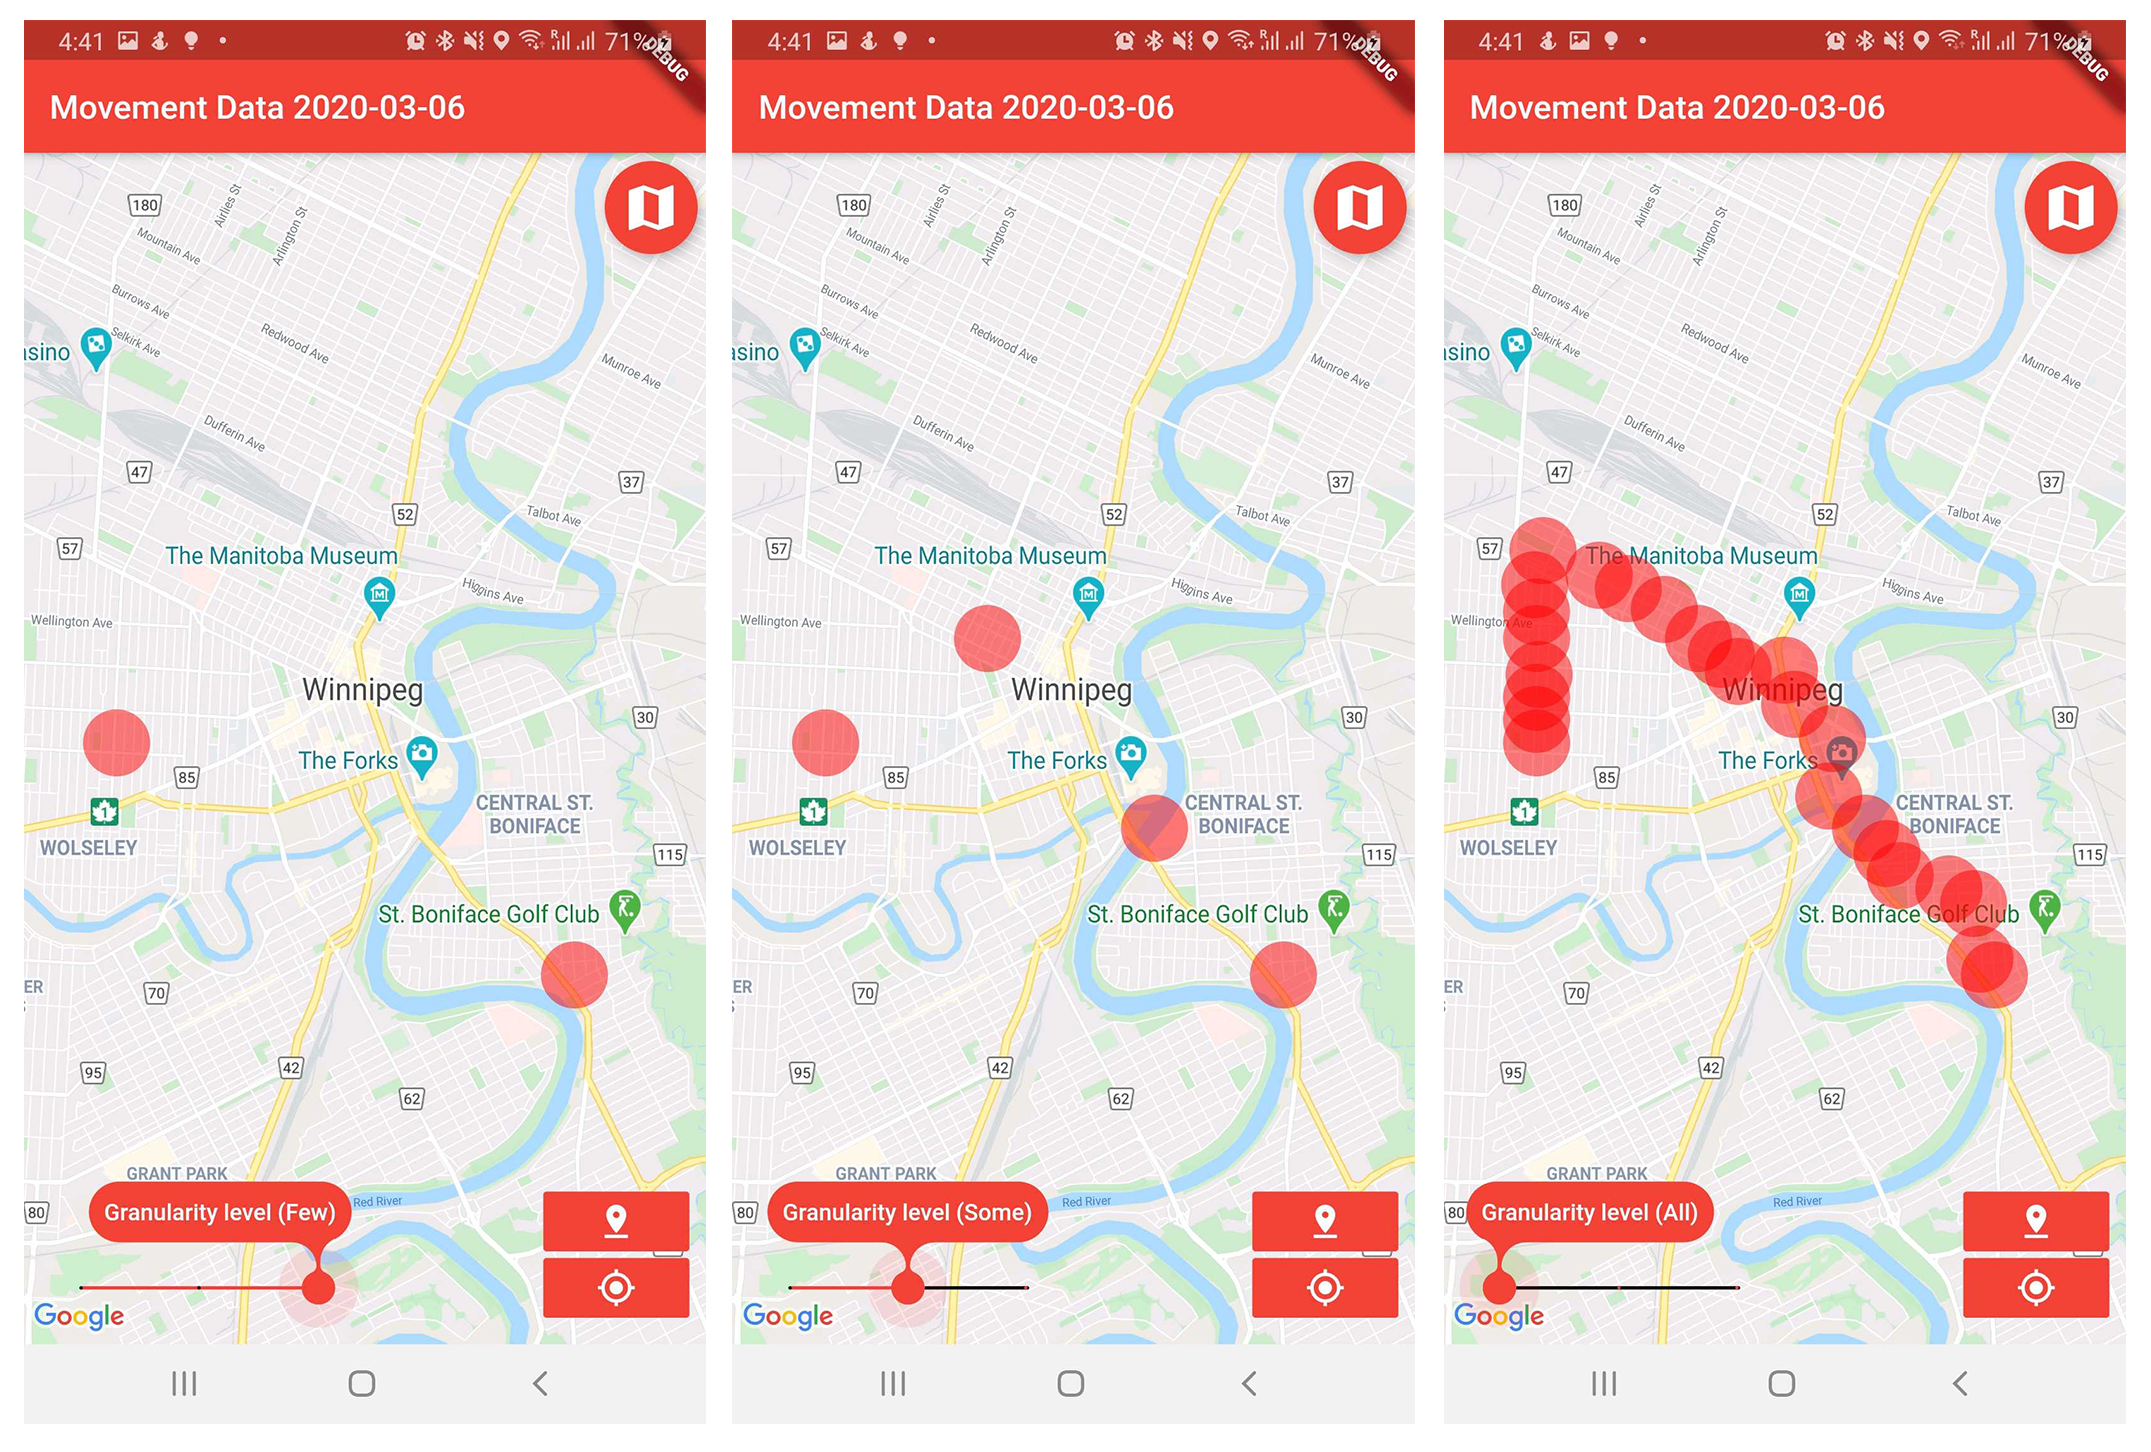
3. COVID-19 Disease Tracking (Mar 2020 – Jun 2020)
Project description: In this project, As a member of the development team, I developed an MVP mobile application for disease tracking during COVID-19 for both Android and iPhone. We explored the possibility of using technology to contain highly infectious diseases through GPS data sharing. Our results show that people are, very often, willing to share their GPS data to contain highly infectious diseases such as COVID-19, as long as their privacy is protected. Our conclusion indicates the great potential to use novel approaches to tackle highly infectious diseases such as COVID-19.
Programming platform: Android, Dart (Flutter). Project Link.
4. Chronic Kidney Disease (CKD) Classification from Real-life Clinical Data (Jan 2020 – May 2020)
Project description: This is an individual project under the Visual and Automated Disease Analytics (VADA) program which is a graduate-level seminar course. This program is a joint initiative between the University of Manitoba and the University of Victoria. As a part of this program, I completed a data science project that included: I) a Data Management Plan, Data dictionary, and Data Quality Report of the CKD data set (II) Analysis which includes Cluster analysis, Regression, Classification, and Dimension reduction, and (III) Visualization of useful insights using Tableau.
Programming platform and Tools: R, Python, and Tableau.
5. In-situation 3D Data visualization and Interaction using a smart wearable ring (Jan 2020 – Mar 2020)
Project description: Wearable technologies, such as watches, rings, and head-worn displays (HWDs) are becoming commonplace nowadays. In this project, we tried to develop a prototype where we are interested to interact and answer some complex queries from a 3D visualization using a smart wearable ring. The main objective was to design some complex and accurate interactions which include analyzing a data set after visualization, performing different actions like selecting, finding patterns, answering some important questions, and revealing better insight from a 3D visualization.
Programming platform and Tools: C#, Unity.